


The first quarter of 2026 has introduced a severe correction to major global equity indices, forcing the international investment herd to navigate a sudden contraction in corporate credit and an unprecedented physical supply shock in the global energy market.
Executive Summary
Global financial markets entered 2026 under the weight of two converging macroeconomic shocks that have fundamentally altered risk premiums across all asset classes. The first is a structural liquidity crisis within the private equity loan market. Elevated base interest rates and rising default projections have triggered a wave of redemption requests across major alternative asset managers, exposing the inherent liquidity mismatches within semi-liquid credit vehicles. The second is a profound geopolitical and energy crisis stemming from the military conflict between the United States, Israel, and Iran. This conflict culminated in the effective closure of the Strait of Hormuz in late February 2026, severing access to approximately 20% of the world’s daily oil consumption and 20% of global liquefied natural gas (LNG) supplies. The resulting inflationary pressure has revived fears of 1970s-style stagflation, sending the S&P 500 and the Nasdaq 100 into deep corrections.
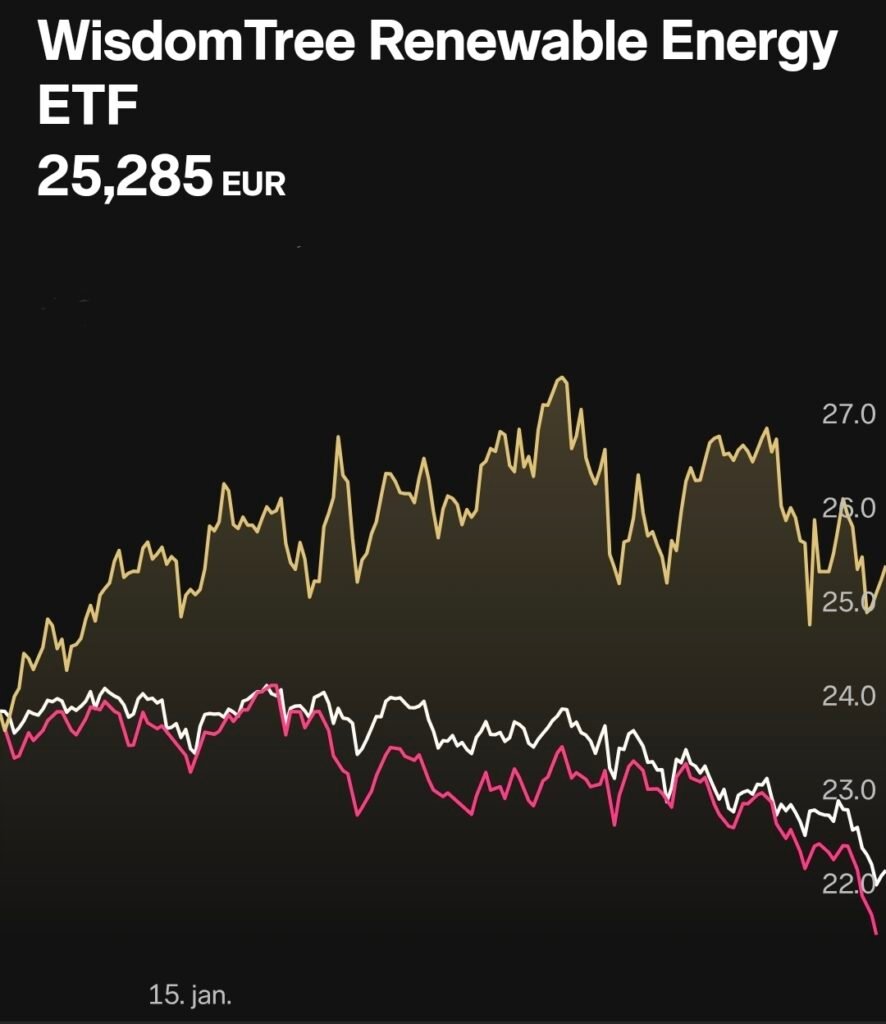
Despite the broad market sell-off, specific renewable energy assets have decoupled from the downward trajectory of traditional equities. The WisdomTree Renewable Energy UCITS ETF (WRNW) recorded a 6.9% gain during the first quarter. This performance divergence reveals a fundamental shift in capital allocation priorities. Renewable energy infrastructure, which relies on domestic natural resources rather than imported fossil fuels, offers a structural hedge against maritime chokepoints and volatile commodity pricing. Furthermore, long-term policy engines, specifically the European Union’s Industrial Accelerator Act (IAA) and China’s 15th Five-Year Plan, are accelerating the deployment of localized clean energy grids through aggressive state backing. For the international investment community, this environment demands a highly disciplined approach. Elephants must recognize that while clean energy equities offer a strategic refuge from fossil fuel disruptions, they carry their own distinct supply chain vulnerabilities, particularly regarding heavy rare earth elements and international trade tariffs.
The Macroeconomic Tremors Shaking the Global Herd
The investment environment in early 2026 is defined by severe constraints on both corporate credit availability and physical commodity logistics. These twin pressures have forced institutional allocators to rapidly reassess their exposure to cyclical growth assets.
The Private Credit Contraction and Liquidity Mismatches
Following the 2008 global financial crisis, increased banking regulations drove corporate lending into the less regulated private credit sector. Over the subsequent fifteen years, this asset class ballooned into an estimated $1.8 trillion to $2.0 trillion global market.1 As base interest rates remained elevated through 2024 and 2025, the floating-rate nature of these loans placed immense pressure on the balance sheets of mid-market borrowers. By the first quarter of 2026, the private credit market faced what analysts termed a ‘Baby Bear’ scenario – a period of forced repricing and rising defaults.3 Fitch Ratings reported that the trailing 12-month private credit default rate reached 5.2% in early 2026, with projections suggesting a climb toward 8%.3
The stress is highly concentrated in the software and Software-as-a-Service (SaaS) sectors, which account for a substantial portion of direct lending portfolios. Many of these debt-burdened technology firms face existential threats from rapid advancements in artificial intelligence, which threaten to automate or render obsolete their recurring revenue models.3 Consequently, lenders have observed a sharp increase in the use of payment-in-kind (PIK) toggles, allowing borrowers to defer cash interest payments by adding the owed interest to the principal loan balance.5 While PIK provisions offer temporary relief from cash-flow insolvency, their widespread activation signals deep underlying distress.
This distress materialized rapidly in the form of investor withdrawal requests. Fearing deteriorating asset quality, retail and institutional investors initiated a run on unlisted business development companies (BDCs) and semi-liquid credit vehicles. In response to redemption demands that far exceeded their available cash reserves, major asset managers were forced to enact structural withdrawal limits. Apollo Global Management capped quarterly redemptions at 5% for its $15.1 billion BDC after investors requested the return of 11.2% of the fund’s net assets.6 Cliffwater limited redemptions to 7% on its $33 billion Corporate Lending Fund against requests totaling 14%.6 Morgan Stanley similarly restricted payouts on its $8 billion North Haven Private Income Fund to 5%, paying out only $169 million against much larger demands.6 Blue Owl Capital faced intense scrutiny after canceling a proposed merger between two of its BDCs and subsequently suspending redemptions on its OBDC II fund in favor of capital distributions.7
For the broader equity markets, the private credit drought introduces significant refinancing risks. If highly leveraged companies cannot access private capital to roll over their maturing debt facilities, they may be forced into restructuring or bankruptcy. This dynamic acts as a heavy anchor on economic growth forecasts and corporate earnings projections.
The Strait of Hormuz Blockade and Fossil Fuel Vulnerability
Compounding the credit contraction is a historic physical supply shock. On February 28, 2026, joint military strikes by the United States and Israel against Iranian installations rapidly escalated into a regional conflict.8 In retaliation, Iran effectively blockaded the Strait of Hormuz, leveraging missile, drone, and naval assets to halt civilian maritime traffic.9
The Strait of Hormuz functions as the central artery of the global hydrocarbon economy. Its closure immediately thwarted the export of approximately 20 million barrels per day (bpd) of crude oil and refined products, representing roughly 20% of total global consumption.11 While alternative pipelines in Saudi Arabia and the United Arab Emirates possess a combined bypass capacity of 3.5 to 5.5 million bpd, the market faces an inescapable net physical shortage of 14.5 to 16.5 million bpd.11 The blockade trapped an estimated 4 million bpd of global spare production capacity within the Persian Gulf, removing the market’s primary mechanism for absorbing supply shocks.11
The blockade also paralyzed the global liquefied natural gas (LNG) trade. On March 18, 2026, military strikes damaged Qatar’s Ras Laffan Industrial City LNG complex.12 This attack knocked 17% of Qatar’s LNG production capacity offline, with repairs estimated to require three to five years.9 Because 20% of the world’s LNG supply transits the Strait, spot prices in Asia surged by over 140%, while European natural gas benchmarks spiked by 70% during the month of March, reaching 54.5 euros per megawatt hour on the Dutch TTF benchmark.12 Crude oil prices reacted violently, with Brent crude spiking from pre-conflict levels of $70 per barrel to a peak of $126 per barrel, before experiencing extreme volatility around the $100 mark.8
The economic damage extends far beyond energy generation. The Gulf region is a major exporter of critical industrial materials. The halt in maritime traffic stranded millions of tonnes of urea and ammonia, causing a global fertilizer shortage just ahead of the Northern Hemisphere’s spring planting season.14 Helium exports, vital for semiconductor manufacturing and medical imaging, were entirely cut off.16 The disruption of these supply chains acts as a regressive tax on the global economy, disproportionately affecting emerging markets in Asia and Africa while forcing central banks in developed nations to abandon planned interest rate cuts to fight imported inflation.
The Equity Market Divergence and the WRNW Oasis
The combination of tightening corporate credit and spiking energy costs created a highly hostile environment for traditional equities. Investors rapidly repriced growth expectations, leading to a significant market correction across major indices.
S&P 500 and Nasdaq 100 Corrections
Throughout the first quarter of 2026, the major United States indices suffered heavy losses. The S&P 500 recorded a decline of 6.96% for the quarter, while the technology-heavy Nasdaq 100 dropped by 8.38%, pushing it near formal correction territory.17 The Dow Jones Industrial Average similarly tumbled, shedding 6.03% over the three-month period.17
The sell-off was driven by a reversal of the macroeconomic assumptions that had supported the market in late 2025. The anticipated transition to a lower-interest-rate environment evaporated as the Hormuz crisis guaranteed persistent, supply-driven inflation. Simultaneously, the artificial intelligence sector, which had carried the indices to record highs, faced heightened scrutiny. Investors began questioning the massive capital expenditure requirements for AI data centers, particularly given the rising cost of electricity and the potential for AI to disrupt the revenue models of software companies held in stressed private credit portfolios.3
Unpacking the WisdomTree Renewable Energy ETF
Amid the widespread equity sell-off, the WisdomTree Renewable Energy UCITS ETF (WRNW) provided a stark contrast. By the end of March 2026, WRNW had achieved a 6.9% increase, decoupling entirely from the S&P 500 and the Nasdaq.
The fund’s performance is rooted in its highly specific methodology. WRNW tracks the WisdomTree Renewable Energy Index, providing targeted exposure to companies actively developing the renewable energy value chain, including solar, wind, and hydrogen technologies.18 As of late March 2026, the ETF managed $27.08 million in assets, with a Net Asset Value (NAV) of $29.119 and a Total Expense Ratio (TER) of 0.45%.19
The portfolio construction of WRNW explains its resilience during the dual macro-shock. The fund is globally diversified, preventing overexposure to the interest-rate sensitivity of the United States market.
WRNW Geographic Exposure (As of March 26, 2026)
| Country | Portfolio Weighting |
| China | 25.17% |
| United States | 23.17% |
| South Korea | 8.45% |
| Japan | 5.77% |
| Italy | 5.13% |
| Germany | 4.50% |
| Israel | 4.28% |
| Canada | 4.10% |
Data sourced from WisdomTree fund disclosures.19
The fund’s asset allocation is heavily tilted toward industrial manufacturing and established utilities rather than speculative consumer technology. The sector breakdown allocates roughly 52.96% to Industrials, 22.08% to Utilities, and 10.93% to Information Technology.19
WRNW Top Holdings (As of March 26, 2026)
| Company Name | Ticker | Portfolio Weighting |
| Beijing Sifang Automation | 601126 | 6.38% |
| Nextracker Inc. | NXT | 4.17% |
| Bloom Energy Corp. | BE | 4.01% |
| Hanwha Solutions Corp. | 009830 | 3.48% |
| Enel SpA | ENEL | 3.14% |
| Doosan Fuel Cell Co Ltd. | 336260 | 2.95% |
| Enlight Renewable Energy | ENLT | 2.74% |
Data sourced from WisdomTree fund disclosures.19
The outperformance of holdings like Beijing Sifang Automation and Nextracker highlights the market’s appetite for companies providing grid infrastructure and solar tracking software. These entities directly benefit from the global mandate to secure independent energy generation capacity.
The Fundamental Shield of Renewable Energy
When the cost of fossil fuels spikes due to maritime blockades, the comparative economics of renewable power generation improve immediately. Once the initial capital expenditure for a wind turbine or a solar array is deployed, the marginal cost of the fuel – wind and sunlight – remains zero. This operational reality entirely insulates domestic power generation from geopolitical risk premiums and shipping insurance surges.22
The 2026 energy shock laid bare the systemic fragility of relying on narrow maritime corridors. The global supply chains for oil, LNG, and fertilizer require constant, uninterrupted physical movement across vast oceans. When war risk insurance premiums for vessels transiting the Persian Gulf surged to 5% of the hull’s value, the cost of transit became prohibitive for many operators.11 Renewable energy systems bypass these physical chokepoints. As former policymakers and energy analysts noted during the crisis, nations that had previously invested heavily in domestic renewable grids found themselves partially insulated from the $120 per barrel oil spikes.22 Power purchase agreements (PPAs) for solar and wind generation provided price certainty to corporations and utility providers at a time when natural gas spot prices were fluctuating wildly by the hour.
Institutional Drivers: Legislative Tailwinds in the EU and China
The economic case for renewable energy is fortified by massive, state-sponsored industrial policies in the world’s largest energy-importing regions. Capital is flowing toward green equities because statutory mandates require a rapid acceleration of domestic manufacturing.
The European Union’s Industrial Accelerator Act
The European Union, acutely aware of its vulnerability to imported energy following the 2022 Russian supply shock and the 2026 Hormuz blockade, has accelerated its legislative mechanisms. The REPowerEU plan, updated in 2023, raised the EU’s binding target for the share of renewable energy in the final energy mix to a minimum of 42.5% by 2030, with an aspirational goal of 45%.23 This requires virtually doubling the existing renewable capacity within a severely compressed timeframe.
To ensure this transition benefits the domestic economy rather than solely foreign manufacturers, the European Commission introduced the Industrial Accelerator Act (IAA) in March 2026.24 The IAA is a definitive pivot from open-market procurement toward strategic industrial protectionism. The legislation mandates that the manufacturing sector’s share of EU GDP must increase to 20% by 2035, up from 14.3% in 2024.24
The IAA enforces strict local content quotas for public procurement and state subsidies. Within three years of the Act entering into force, solar projects awarded through public auctions will be required to use inverters and cells manufactured within the European Union.24 Similarly, batteries deployed in the bloc will need to source a minimum number of components domestically. The legislation also introduces stringent screening for foreign direct investment (FDI) exceeding 100 million euros in strategic sectors where a single third country controls over 40% of global manufacturing capacity. This provision compels foreign entities to license intellectual property and employ local workers.24 For European renewable stocks and grid operators, the IAA provides a captive market and a protective regulatory environment against cheaper international imports.
China’s 15th Five-Year Plan and Sector Dominance
Simultaneously, China continues to cement its position as the undisputed hegemon of clean energy manufacturing. During the political meetings in March 2026, the Chinese government approved its 15th Five-Year Plan, governing the period from 2026 to 2030.27 While the plan reported a somewhat relaxed carbon intensity reduction target of 17% over the five-year period, it explicitly prioritized the rapid scaling of clean energy infrastructure as a mechanism for economic growth and national security.28
By early 2026, China’s total power capacity had reached an astounding 3,890 gigawatts (GW), with renewable generation effectively meeting the entirety of the nation’s new electricity demand growth.29 The clean energy sector in China has expanded so rapidly that, if treated as a standalone economy, it would rank as the eighth largest in the world.29
China is aggressively securing the upstream resources necessary to maintain its manufacturing monopoly. A 2026 report indicated that China committed over $120 billion in outbound foreign direct investment (OFDI) specifically targeted at resource mining and processing in the Global South.31 By securing long-term offtake agreements for lithium, copper, bauxite, and rare earth elements, China is building a vertically integrated green industrial complex that guarantees the profitability of the Chinese equities heavily represented in ETFs like WRNW.
Comparative Analysis of Alternative Energy ETFs
While WRNW posted a 6.9% gain in Q1 2026, the broader clean energy ETF universe experienced significant dispersion in performance. Elephants must conduct rigorous due diligence, as the label “clean energy” obscures vast differences in sub-sector allocation, geographic exposure, and market capitalization weighting.
The Clean Energy Universe
To visualize the structural differences driving Q1 2026 performance, the following table details the primary characteristics of the major funds.
Clean Energy ETF Landscape (Data as of March 2026)
| Fund Name | Ticker | AUM ($) | Expense Ratio | Primary Strategy Focus |
| WisdomTree Renewable Energy | WRNW | $27.08 M | 0.45% | Global value chain, Industrial/Utility focus |
| iShares Global Clean Energy | ICLN | $2.1 B | 0.39% | Broad global renewables, Large-cap tilt |
| First Trust Clean Edge | QCLN | $571.2 M | 0.56% | US-heavy, EV and smart grid focus |
| Invesco Solar ETF | TAN | $1.5 B | 0.69% | Pure-play global solar manufacturing |
| Invesco WilderHill Clean Energy | PBW | $513.1 M | 0.64% | Equal-weight, Small/Mid-cap US focus |
Data compiled from fund disclosures and market analysis.19
Large-Cap and Global Diversification
With over $2.0 billion in assets under management (AUM), the iShares Global Clean Energy ETF (ICLN) is the largest and most liquid ETF in the space.32 The fund tracks the S&P Global Clean Energy Index and maintains a relatively low expense ratio of 0.39%.32 ICLN holds approximately 100 stocks, with a geographic distribution of roughly 30% in the United States and 70% internationally.37 Top holdings include First Solar, Iberdrola, and Vestas Wind Systems. During the geopolitical turbulence of Q1 2026, ICLN demonstrated relative strength, rising approximately 11% year-to-date by late March.34 The fund benefited from its exposure to established, profitable utility companies and large-cap equipment manufacturers that could absorb supply chain shocks more easily than early-stage developers.
The Vulnerability of High-Beta and Pure-Play Funds
Conversely, funds heavily concentrated in domestic United States small-caps, specialized electric vehicles, or single-sector technologies absorbed the brunt of the interest rate and supply chain anxieties.
The First Trust NASDAQ Clean Edge Green Energy ETF (QCLN), managing $571.2 million in AUM with an expense ratio of 0.56%, offers a starkly different risk profile.32 Unlike ICLN or WRNW, QCLN allocates heavily to electric vehicle manufacturers, advanced materials, and energy storage.37 Consequently, its portfolio is highly concentrated in the United States (approximately 93%) and heavily weighted toward high-beta technology stocks like Tesla, ON Semiconductor, and Rivian.36 During Q1 2026, QCLN faced severe headwinds. The fund tumbled as the broader semiconductor sector sold off and electric vehicle demand projections softened amid elevated interest rates and supply chain fears.
The Invesco WilderHill Clean Energy ETF (PBW), with $513.1 million in AUM and a 0.64% expense ratio, tracks an equal-weighted index of US-listed clean energy companies.32 Because it is equal-weighted, PBW inherently tilts toward small-cap and mid-cap companies compared to its market-cap-weighted peers. Holdings include Amprius Technologies, Darling Ingredients, and Advanced Energy Industries.33 In Q1 2026, PBW struggled, declining by nearly 3.91% in February alone.38 The fund was weighed down by its exposure to smaller, unprofitable cleantech firms that were disproportionately harmed by the tight lending conditions and the private credit contraction occurring simultaneously in the US economy.
The Invesco Solar ETF (TAN) provides pure-play exposure to the solar energy industry, managing $1.5 billion in AUM with an expense ratio of 0.69%.33 The fund concentrates entirely on solar panel manufacturers, installers, and component suppliers, with top holdings including Nextpower, Enlight Renewable Energy, and Enphase Energy.33 Solar equities are notoriously cyclical and highly sensitive to interest rates, as utility-scale projects require massive upfront debt financing. While TAN offers concentrated upside during periods of aggressive solar deployment, it lacks the dampening effect of diversified utility holdings found in WRNW or ICLN.
The Predator in the Grass: Clean Energy Supply Chain Vulnerabilities
While the thesis that renewable energy provides a safe haven from the Strait of Hormuz is robust regarding the operation of power grids, Elephants must acknowledge a critical counter-argument regarding the manufacturing of the underlying assets. Clean energy infrastructure requires massive quantities of critical minerals and refined metals. The transition from a fossil fuel economy to an electrified economy does not eliminate supply chain vulnerability; it merely shifts the geographic coordinates of the chokepoints.
Extreme Geographic Concentration
The global clean energy supply chain is characterized by extreme geographic concentration, posing a severe risk to deployment schedules. The International Energy Agency (IEA), in its 2026 Energy Technology Perspectives report, conducted an ‘N-1’ supply chain security analysis to evaluate global resilience if the single largest supplier were removed from the market.39 The findings were stark. Every major energy technology supply chain contains at least one step where less than 25% of global demand could be met without the dominant manufacturer.39
China controls approximately 85% of global solar manufacturing capacity, 80% of lithium-ion battery production, 95% of photovoltaic wafers, and 97% of battery anode materials.40 The vulnerability extends deeply into wind turbine components and permanent magnets. China processes roughly 90% of the world’s rare earth elements and produces 94% of the sintered permanent magnets utilized in wind turbines and electric vehicle motors.41
Rare Earth Export Controls
This concentration transitioned from a theoretical risk to an active market disruptor in early 2026. The Chinese Ministry of Commerce introduced strict export controls on seven heavy rare earth elements – including samarium, gadolinium, dysprosium, and terbium – as well as all related compounds and magnets.42 Furthermore, the regulations applied the foreign direct product rule (FDPR), a mechanism historically used by the United States. This application requires foreign companies to obtain Chinese government licenses to export magnets containing even trace amounts of Chinese-origin rare earths, or magnets produced using Chinese processing technologies.44
These export delays created immediate friction for Western manufacturers. The IEA estimated that a one-month halt in Chinese battery supply chain exports would reduce electric car factory output elsewhere by $17 billion, with the majority of the losses hitting the European Union.39 A similar disruption to the solar supply chain would slash output by $1 billion.39
Navigating the Manufacturing Bottleneck
Furthermore, the Strait of Hormuz crisis indirectly impacted the physical construction of renewable assets. The Middle East accounts for roughly 9% of global aluminum production, an essential material for solar panel frames, wind turbine nacelles, and grid infrastructure.22 The maritime blockade stranded shipments of aluminum and sharply increased smelting costs across Asia and Europe due to the lack of natural gas feedstock, causing renewable component prices to inflate.
Investors must realize that while a wind farm operating in Germany is immune to Middle Eastern oil shocks, the construction of the next wind farm is highly vulnerable to Chinese export quotas and maritime freight rates. The 6.9% gain in WRNW was partly driven by its 25.17% allocation to Chinese equities, which allowed the fund to benefit from the monopolistic pricing power of Chinese component manufacturers during a period of constrained global supply. Diversification across the entire global value chain remains the only viable strategy to mitigate these acute manufacturing bottlenecks.
Fixed Income Alternatives: The Green Bond Refuge
Given the extreme volatility in the equity markets – characterized by the S&P 500 correction and the high-beta swings of specialized ETFs like QCLN – institutional herds seeking absolute capital preservation must look toward fixed income. The global sustainable debt market provides a stable watering hole, functioning independently from the private credit loan crisis.
The Maturing Sustainable Debt Market
Total outstanding green bond issuance surpassed the $3 trillion milestone in late 2025 and is marching toward a projected $5.5 to $6 trillion by 2027.45 The issuance of sustainable bonds is expected to stabilize at $800 billion to $900 billion in 2026.45
Regulatory clarity is driving institutional capital into this space. The European Union’s updated Sustainable Finance Disclosure Regulation (SFDR 2.0) requires multi-asset funds seeking “Sustainable” or “Transition” labels to maintain strict minimum allocations to verified green bonds, often utilizing a 15% taxonomy safe harbor.47 This regulatory mandate guarantees persistent, price-agnostic buyer demand for green debt issuance from both corporate and sovereign entities.
iShares USD Green Bond ETF
The iShares USD Green Bond ETF (BGRN) exemplifies this defensive utility. BGRN tracks an index of US dollar-denominated, investment-grade green bonds issued to fund environmental projects.48 By strictly holding investment-grade debt, the fund isolates investors from the default risks currently terrifying the private equity loan sector.
In Q1 2026, green bond funds demonstrated resilience against the macroeconomic turbulence. While the sudden spike in inflation caused by the Hormuz closure pushed US Treasury yields higher – with the 10-year yield climbing to 4.46% by late March – the underlying credit quality of green bonds supported their valuations.12 For the prudent investor, allocating a portion of the portfolio to investment-grade green bonds serves as a vital counterbalance. It provides steady coupon income and mitigates the severe downside volatility associated with early-stage renewable equity investments, allowing the herd to wait patiently through the current storm of interest rate uncertainty.
Elephant Conclusions for the Herd
The macroeconomic environment of early 2026 demands a highly selective and patient approach to capital allocation. The era of cheap, abundant private credit has ended, leaving highly leveraged, unlisted corporate borrowers exposed to rising defaults and structural liquidity mismatches. Simultaneously, the historic disruption in the Strait of Hormuz proves that the global economy’s reliance on imported fossil fuels and concentrated maritime chokepoints remains a profound systemic liability.
For the herd, the 6.9% Q1 2026 return of the WisdomTree Renewable Energy ETF (WRNW) against a backdrop of broad market decline serves as a critical indicator. It demonstrates that capital is flowing toward assets that offer structural independence from fossil fuel volatility.
However, Elephants must not blindly stampede into the clean energy label. The divergence between the positive returns of globally diversified, industrial-weighted funds like WRNW or ICLN, and the negative performance of US-centric, high-beta funds like PBW and QCLN, requires careful attention. Due diligence dictates avoiding companies wholly dependent on cheap debt for survival, or those highly exposed to consumer discretionary spending.
Investors should position portfolios to capture the secular growth of the energy transition while hedging against hardware supply chain concentration. This can be achieved by blending exposure to global, large-cap renewable infrastructure equities with the capital preservation offered by investment-grade green bonds. Recognize that while China’s dominance in rare earth processing poses a geopolitical risk to Western manufacturers, it also presents an investment reality; broad geographic diversification ensures participation in the profits of the dominant component suppliers.
Conclusions of the Article
The financial landscape of 2026 is being reshaped by the violent intersection of credit contraction and geopolitical conflict. The distress in the $1.8 trillion private equity loan market and the suspension of withdrawals at major credit funds indicate that the corporate debt cycle is turning aggressively. Concurrently, the blockade of the Strait of Hormuz has enacted an immediate, physical constraint on 20% of the world’s oil and LNG supply, ensuring that inflationary pressures will remain stubbornly high.
In this environment, the traditional 60/40 portfolio faces intense pressure. Yet, the outperformance of specific renewable energy indices highlights a viable path forward. The global transition toward localized, clean power generation is accelerating not merely out of environmental concern, but out of sheer economic and national security necessity. Supported by massive industrial policy frameworks like the EU’s Industrial Accelerator Act and China’s 15th Five-Year Plan, the fundamental economics of the renewable transition are sound. By avoiding the speculative fringes of the cleantech market and focusing on established infrastructure developers, equipment manufacturers, and green fixed-income assets, investors can safely navigate the immediate turbulence and position themselves for long-term, sustainable growth.
Sources
Following Blackstone and BlackRock, Morgan Stanley, the credit crisis has hardly dissipated due to a.. – MK, accessed on March 30, 2026, https://www.mk.co.kr/en/world/11986700
Why concerns are growing over the private credit market – Marketplace, accessed on March 30, 2026, https://www.marketplace.org/story/2026/02/26/why-concerns-are-growing-over-the-private-credit-market
Private credit: Is the Goldilocks period over for credit?, accessed on March 30, 2026, https://think.ing.com/opinions/is-the-goldilocks-period-over-for-private-credit/
The Market Is Worried That Private Credit Is the Next Shoe to Drop. 5 Things Investors Need to Know., accessed on March 30, 2026, https://www.fool.com/investing/2026/03/26/the-market-is-worried-that-private-credit-is-the-n/
Private Credit Outlook 2026: The Market Faces its First Big Test – With Intelligence, accessed on March 30, 2026, https://www.withintelligence.com/insights/private-credit-outlook-2026/
Amid the ongoing private equity loan crisis, which is the “brainer” of the U.S. financial market, la.. – MK, accessed on March 30, 2026, https://www.mk.co.kr/en/world/11997127
Private Credit Funds Face Redemption Crisis – Wealth Management, accessed on March 30, 2026, https://www.wealthmanagement.com/alternative-investments/private-credit-confronts-the-limitations-of-the-semi-liquid-label
2026 Strait of Hormuz crisis – Wikipedia, accessed on March 30, 2026, https://en.wikipedia.org/wiki/2026_Strait_of_Hormuz_crisis
Economic impact of Iran war already widespread, expert explains …, accessed on March 30, 2026, https://news.vt.edu/articles/2026/03/Iran-Israel-Trump-gas-LNG-prices-Strait-Hormuz-economic-impact.html
Conflict in the Strait of Hormuz is spilling into the Indian Ocean, accessed on March 30, 2026, https://www.chathamhouse.org/2026/03/conflict-strait-hormuz-spilling-indian-ocean
The Iran War and the End of the US-Gulf “Oil for Security” Deal, accessed on March 30, 2026, https://arabcenterdc.org/resource/the-iran-war-and-the-end-of-the-us-gulf-oil-for-security-deal/
Economic impact of the 2026 Iran war – Wikipedia, accessed on March 30, 2026, https://en.wikipedia.org/wiki/Economic_impact_of_the_2026_Iran_war
European Natural Gas Surges 70% Amid West Asia Geopolitical Crisis, accessed on March 30, 2026, https://markets.financialcontent.com/stocks/article/marketminute-2026-3-27-european-natural-gas-surges-70-amid-west-asia-geopolitical-crisis
Strait of Hormuz blockade bites global chemicals sector, accessed on March 30, 2026, https://www.woodmac.com/news/opinion/strait-of-hormuz-blockade-bites-global-chemicals-sector/
Strait of Hormuz closure triggers global supply shock with disproportionate food security risks – Kiel Institute for the World Economy, accessed on March 30, 2026, https://www.kielinstitut.de/publications/news/strait-of-hormuz-closure-triggers-global-supply-shock-with-disproportionate-food-security-risks/
The Strait of Hormuz is not just an oil chokepoint | US-Israel war on Iran | Al Jazeera, accessed on March 30, 2026, https://www.aljazeera.com/opinions/2026/3/27/the-strait-of-hormuz-is-not-just-an-oil-chokepoint
US Equities Slide into Correction Territory as Middle East Tensions Escalate | IG Bank Switzerland, accessed on March 30, 2026, https://www.ig.com/en-ch/news-and-trade-ideas/us-equities-slide-into-correction-territory-as-middle-east-tensi-260330
WisdomTree Renewable Energy (WREN) – InvestEngine, accessed on March 30, 2026, https://investengine.com/etfs/wisdomtree/wren/
WisdomTree Renewable Energy UCITS ETF – USD Acc GB, accessed on March 30, 2026, https://www.wisdomtree.eu/en-gb/etfs/thematic/wrnw—wisdomtree-renewable-energy-ucits-etf—usd-acc
WRNW ETF Analysis: Dividends, Returns LSE:WRNW – TradingView, accessed on March 30, 2026, https://www.tradingview.com/symbols/LSE-WRNW/analysis/
WTRENE – WisdomTree Renewable Energy Index, accessed on March 30, 2026, https://www.wisdomtree.com/investments/index/wtrene
What does the Iran war mean for clean energy transition?, accessed on March 30, 2026, https://www.theguardian.com/environment/2026/mar/26/iran-war-clean-energy-transition
Renewable energy targets – European Commission, accessed on March 30, 2026, https://energy.ec.europa.eu/topics/renewable-energy/renewable-energy-directive-targets-and-rules/renewable-energy-targets_en
Renewables included in EU ‘made in Europe’ quotas for low-carbon …, accessed on March 30, 2026, https://knowledge.energyinst.org/new-energy-world/article?id=140164
EUROPEAN COMMISSION Brussels, 4.3.2026 COM(2026) 100 final 2026/0068 (COD) Proposal for a REGULATION OF THE EUROPEAN PARLIAMENT, accessed on March 30, 2026, https://single-market-economy.ec.europa.eu/document/download/9bc8eb85-4d43-4025-be7b-c86b9f3648ec_en?filename=Proposal%20establishing%20measures%20for%20industrial%20capacity%20and%20decarbonisation%20in%20strategic%20sectors%20.pdf
EU Industrial Accelerator Act (IAA) – Carbon Gap – Policy Tracker, accessed on March 30, 2026, https://tracker.carbongap.org/policy/industrial-accelerator-act/
China Briefing 5 March 2026: New five-year climate goals revealed at ‘two sessions’ meeting, accessed on March 30, 2026, https://www.carbonbrief.org/china-briefing-5-march-2026-new-five-year-climate-goals-revealed-at-two-sessions-meeting/
REACTION: China’s 15th five year plan, accessed on March 30, 2026, https://climateactiontracker.org/press/reaction-chinas-15th-five-year-plan/
China Briefing 5 February 2026: Clean energy’s share of economy | Record renewables | Thawing relations with UK, accessed on March 30, 2026, https://www.carbonbrief.org/china-briefing-5-february-2026-clean-energys-share-of-economy-record-renewables-thawing-relations-with-uk/
China Energy Transition Review 2025 – Ember, accessed on March 30, 2026, https://ember-energy.org/latest-insights/china-energy-transition-review-2025/
China Secures Global Green Energy Dominance with $120 Billion Investment, accessed on March 30, 2026, https://carboncopy.info/china-secures-global-green-energy-dominance-with-120-billion-investment
5 Biggest Clean Energy ETFs in 2026 | INN – Investing News Network, accessed on March 30, 2026, https://investingnews.com/green-energy-etf/
7 Best Clean Energy ETFs to Consider in 2026 | The Motley Fool, accessed on March 30, 2026, https://www.fool.com/investing/stock-market/market-sectors/energy/renewable-energy-stocks/clean-energy-etf/
iShares Global Clean Energy ETF Stock Price: Quote, Forecast, Splits & News (ICLN), accessed on March 30, 2026, https://www.perplexity.ai/finance/ICLN
5 top clean energy ETFs 2026: funds powering the future, accessed on March 30, 2026, https://blog.investengine.com/5-top-clean-energy-etfs-2026-funds-powering-the-future/
First Trust NASDAQ Clean Edge Green Energy Index Fund Stock Price: Quote, Forecast, Splits & News (QCLN) – Perplexity, accessed on March 30, 2026, https://www.perplexity.ai/finance/QCLN?comparing=QCLN,PSFF,ROUS,FCTE,PBW,FNGO
6 Clean Energy Funds to Consider | Morningstar, accessed on March 30, 2026, https://www.morningstar.com/sustainable-investing/5-clean-energy-funds-consider
Chart of the Week: March 9, 2026: Top performing ETFs diverged in February 2026, accessed on March 30, 2026, https://sustainableinvest.com/chart-of-the-week-march-9-2026-top-performing-etfs-diverged-in-february-2026/
Strengthening supply chains can improve resilience and reduce economic security risks for key energy technologies, accessed on March 30, 2026, https://www.iea.org/news/strengthening-supply-chains-can-improve-resilience-and-reduce-economic-security-risks-for-key-energy-technologies
Supply chain risks and industrial competitiveness – Energy Technology Perspectives 2026 – Analysis – IEA, accessed on March 30, 2026, https://www.iea.org/reports/energy-technology-perspectives-2026/supply-chain-risks-and-industrial-competitiveness
Supply Chain Risk to Manufacturers From China’s Dominance in Rare Earth and Critical Mineral Processing, accessed on March 30, 2026, https://rareearthexchanges.com/news/supply-chain-risk-to-manufacturers-from-chinas-dominance-in-rare-earth-and-critical-mineral-processing/
With new export controls on critical minerals, supply concentration risks become reality, accessed on March 30, 2026, https://www.iea.org/commentaries/with-new-export-controls-on-critical-minerals-supply-concentration-risks-become-reality
The Consequences of China’s New Rare Earths Export Restrictions – CSIS, accessed on March 30, 2026, https://www.csis.org/analysis/consequences-chinas-new-rare-earths-export-restrictions
China’s New Rare Earth and Magnet Restrictions Threaten U.S. Defense Supply Chains – CSIS, accessed on March 30, 2026, https://www.csis.org/analysis/chinas-new-rare-earth-and-magnet-restrictions-threaten-us-defense-supply-chains
Sustainable Bonds Global Outlook 2026: Consolidation, Not Expansion, accessed on March 30, 2026, https://www.spglobal.com/ratings/en/regulatory/article/sustainability-insights-sustainable-bonds-global-outlook-2026-consolidation-not-expansion-s101668325
Green debt market passes $3 trillion milestone – LSEG, accessed on March 30, 2026, https://www.lseg.com/en/insights/green-debt-market-passes-3-trillion-milestone
GSS Bonds Report, January 2026 – esgeverything, accessed on March 30, 2026, https://esgeverything.com/wp-content/uploads/2026/01/GSS-Bonds-Market-Trends-Report-January-2026-by-MainStreet-Partners.pdf
iShares USD Green Bond ETF | BGRN – BlackRock, accessed on March 30, 2026, https://www.blackrock.com/us/financial-professionals/products/305296/ishares-usd-green-bond-etf